Plotting methods also allow for different plot styles from pandas along with the default geo plot. These methods can be accessed using the kind keyword argument in plot(), and include:
绘图方法还允许使用来自 pandas 的不同绘图样式以及默认的地理绘图。可以使用 plot() 中的 kind 关键字参数访问这些方法,包括:
geofor mappinglinefor line plotsbarorbarhfor bar plotshistfor histogramboxfor boxplotkdeordensityfor density plotsareafor area plotsscatterfor scatter plotshexbinfor hexagonal bin plotspiefor pie plots
In [43]: gdf = world.head(10)

In [44]: gdf.plot(kind='scatter', x="pop_est", y="gdp_md_est")
Out[44]: <AxesSubplot: xlabel='pop_est', ylabel='gdp_md_est'>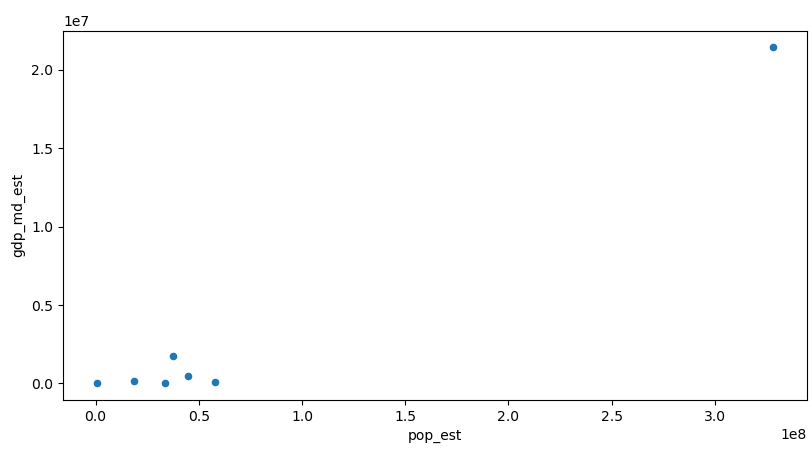
You can also create these other plots using the GeoDataFrame.plot.<kind> accessor methods instead of providing the kind keyword argument.
您还可以使用 GeoDataFrame.plot.<kind> 访问器方法创建这些其他图,而不需提供 kind 关键字参数。
In [45]: gdf.plot.bar()
Out[45]: <AxesSubplot: >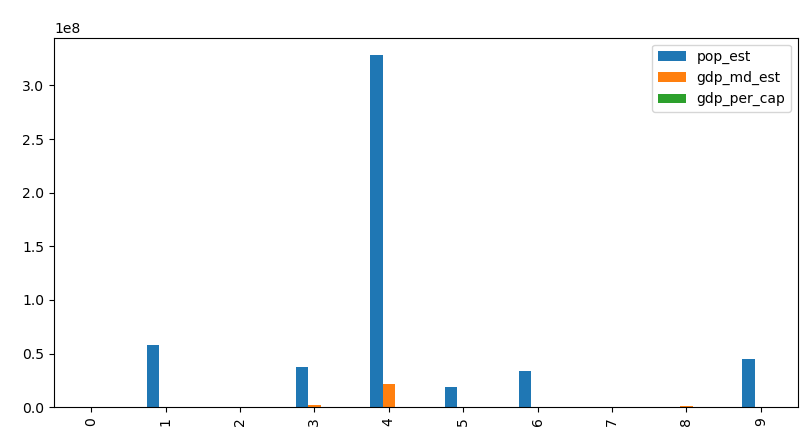
For more information check out the pandas documentation.
更多信息请查看pandas文档。